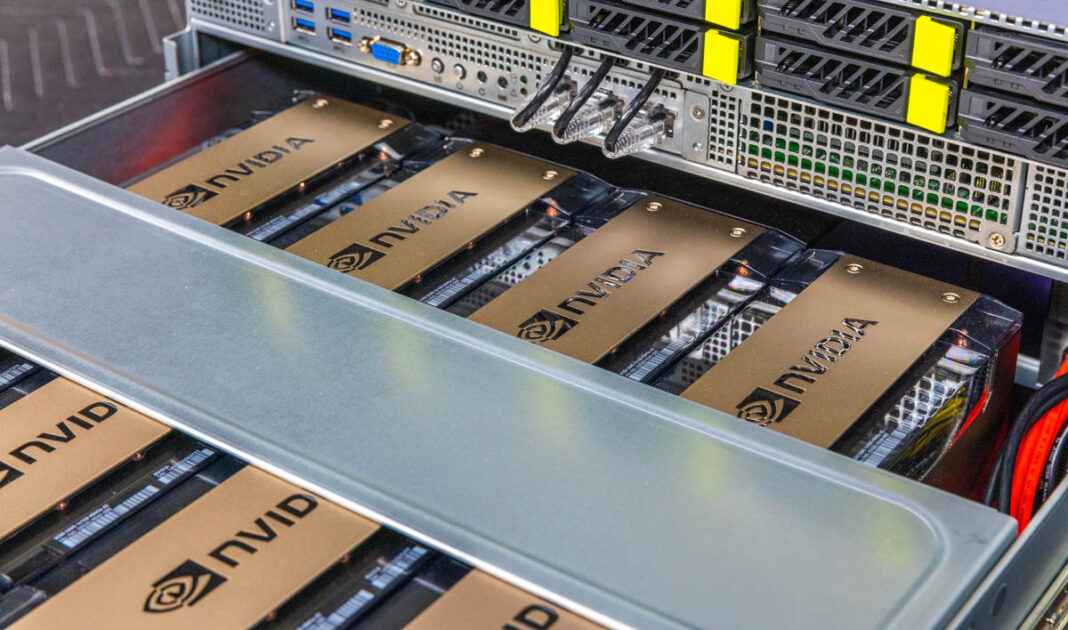
NVIDIA HGX H200 server (source: servethehome.com)
Part 1 covered vllm serve arguments by model type. This post is a follow-up: a rundown of the problems I hit trying to run LLM + Embedding + OCR — three models simultaneously on two H200s — and how I solved them.
The environment is H200 80 GB × 2, 160 GB total VRAM. The three models:
- Qwen3.6-35B-A3B (LLM, MoE)
- Qwen3-Embedding-8B (Embedding)
- DeepSeek-OCR-2 (OCR, multimodal)
Launch this combination without a plan and you'll almost certainly hit OOM when starting the second or third model.
The core problem: what it actually means to share VRAM
When a vLLM process starts, it immediately reserves the fraction of VRAM specified by --gpu-memory-utilization. It doesn't wait until memory is needed — it claims it upfront.
If all three processes share the same GPUs, OOM occurs the moment the sum of their gpu-memory-utilization values exceeds 1.0 — more precisely, when the total memory they're trying to claim exceeds the physical VRAM.
Estimating minimum VRAM per model
A model's VRAM footprint breaks down into two parts.
Weights
At BF16, it's parameter count × 2 bytes.
- Qwen3-Embedding-8B: 8B × 2 = 16 GB
- DeepSeek-OCR-2: ~7B scale, roughly 16 GB (slightly more with the vision encoder)
- Qwen3.6-35B-A3B: 35B × 2 = 70 GB
That third one is the critical one. Qwen3.6-35B-A3B is a MoE (Mixture of Experts) model, so only 3B parameters are active during inference — but all 35B weights still have to be loaded into VRAM. Don't be fooled into thinking "3B active params means it's lightweight."
KV Cache
The KV cache is reserved based on --max-model-len, the model's number of layers, and the number of heads. The higher you set --max-model-len, the more VRAM gets reserved for the KV cache. vLLM uses whatever memory remains after weights within the gpu-memory-utilization budget for the KV cache.
So:
Available KV cache = (gpu-memory-utilization × GPU_VRAM) - weight size
If this is zero or negative, the process won't start.
Budgeting memory for H200 × 2
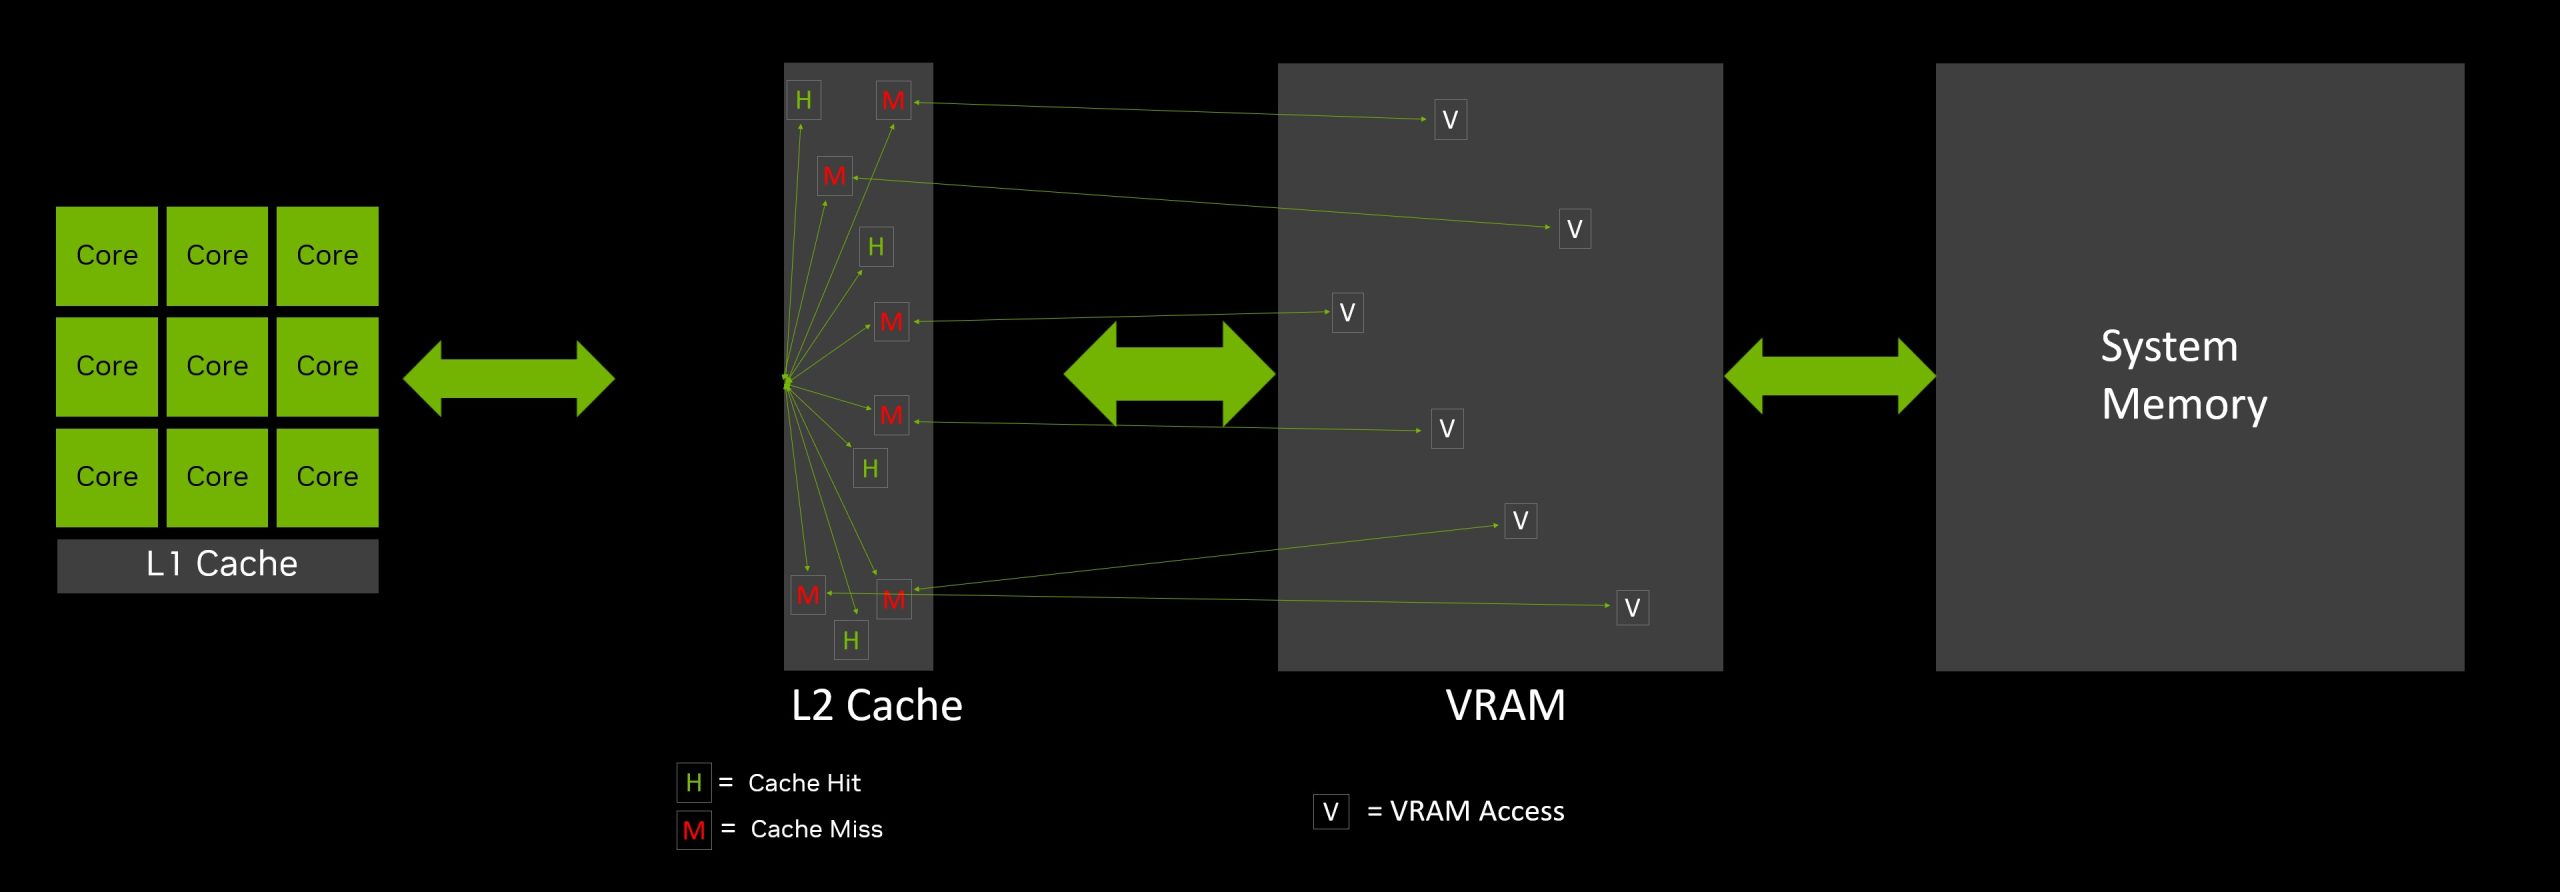
GPU memory requirements by model size (source: unfoldai.com)
If all three models run with tp=2 (tensor parallel across both GPUs), each GPU sees the following:
Per-GPU weight footprint (80 GB each):
| Model | Per-GPU weight at tp=2 |
|---|---|
| Qwen3.6-35B-A3B | ~35 GB |
| Qwen3-Embedding-8B | ~8 GB |
| DeepSeek-OCR-2 | ~8 GB |
| Total | ~51 GB |
Per-GPU headroom: 80 − 51 = ~29 GB
Subtract CUDA context overhead. Three processes sharing the same GPU each consume roughly 1–2 GB of context, so at least 3–6 GB disappears. The effective KV cache budget is around 23–26 GB per GPU.
gpu-memory-utilization values must fit within this budget.
Recommended allocation (tp=2 shared approach):
| Model | gpu-memory-utilization | Per-GPU reservation |
|---|---|---|
| Qwen3.6-35B-A3B | 0.60 | 48 GB |
| Qwen3-Embedding-8B | 0.15 | 12 GB |
| DeepSeek-OCR-2 | 0.15 | 12 GB |
| **Total | 0.90 | 72 GB** |
The remaining 8 GB has to cover CUDA overhead. This works, but just barely.
A more stable approach: GPU isolation
Rather than having all three models share both GPUs with tp=2, assigning each smaller model to a single GPU is more stable.
GPU 0: Qwen3.6-35B-A3B (LLM, half of tp=2) + Qwen3-Embedding-8B (tp=1)
GPU 1: Qwen3.6-35B-A3B (LLM, half of tp=2) + DeepSeek-OCR-2 (tp=1)
Use the CUDA_VISIBLE_DEVICES environment variable to restrict each process to specific GPUs.
# LLM — uses GPU 0 and 1 (tp=2)
CUDA_VISIBLE_DEVICES=0,1 vllm serve Qwen/Qwen3.6-35B-A3B \
  --host 0.0.0.0 \
  --port 10010 \
  --tensor-parallel-size 2 \
  --max-model-len 65536 \
  --gpu-memory-utilization 0.60 \
  --served-model-name Qwen3.6 \
  --enable-expert-parallel \
  --enable-auto-tool-choice \
  --tool-call-parser qwen3_coder

# Embedding — GPU 0 only (tp=1)
CUDA_VISIBLE_DEVICES=0 vllm serve /path/to/Qwen3-Embedding-8B \
  --host 0.0.0.0 \
  --port 10020 \
  --tensor-parallel-size 1 \
  --max-model-len 16384 \
  --gpu-memory-utilization 0.20 \
  --enforce-eager

# OCR — GPU 1 only (tp=1)
CUDA_VISIBLE_DEVICES=1 vllm serve deepseek-ai/DeepSeek-OCR-2 \
  --host 0.0.0.0 \
  --port 10030 \
  --tensor-parallel-size 1 \
  --max-model-len 8192 \
  --max-num-batched-tokens 8192 \
  --gpu-memory-utilization 0.20 \
  --logits_processors vllm.model_executor.models.deepseek_ocr:NGramPerReqLogitsProcessor \
  --no-enable-prefix-caching \
  --mm-processor-cache-gb 0 \
  --enforce-eager
Actual per-GPU usage:
| GPU 0 | GPU 1 | |
|---|---|---|
| LLM (tp=2) | 48 GB (0.60×80) | 48 GB (0.60×80) |
| Embedding (tp=1) | 16 GB (0.20×80) | - |
| OCR (tp=1) | - | 16 GB (0.20×80) |
| **Total | 64 GB | 64 GB** |
| **Headroom | 16 GB | 16 GB** |
With 16 GB of headroom per GPU, there's plenty of room for CUDA overhead and some KV cache growth.
Common errors
OOM (Out of Memory)
torch.cuda.OutOfMemoryError: CUDA out of memory.
Tried to allocate X GiB.
The most common error. The cause is almost always either the sum of gpu-memory-utilization values exceeding physical VRAM, or --max-model-len being set so high that the KV cache reservation crowds out the weights.
Fix in this order:
- Reduce
--max-model-len(biggest impact) - Lower
--gpu-memory-utilization - Add
--enforce-eagerto skip CUDA graph memory allocation
Warning: KV cache is too small
Check the vLLM startup log for this line:
INFO: # GPU blocks: 128, # CPU blocks: 0
Fewer than 100 GPU blocks means there's almost no KV cache. Even a modest burst of concurrent requests will cause long queues or outright rejections. Lower --max-model-len or raise --gpu-memory-utilization to free up more KV cache budget.
DeepSeek-OCR-2 produces garbage output
Running the OCR model without --logits_processors results in infinitely repeated text or completely wrong content. This argument is not optional.
--logits_processors vllm.model_executor.models.deepseek_ocr:NGramPerReqLogitsProcessor
Qwen3.6-35B-A3B throughput is too low
Loading a MoE model without --enable-expert-parallel disables expert-layer parallelism, which significantly tanks throughput. This flag is required when running with tp=2.
--enable-expert-parallel
Worker dies during CUDA graph capture
A pattern where the process crashes with this log combination during startup:
profiling CUDA graph memory: piecewise=51 large=512 full=51
...
worker proc vllmworker-1 died unexpectedly
The worker is dying during CUDA graph capture. The failure sequence looks roughly like this:
vLLM starts
 → model weights loaded
 → determine_available_memory() runs
 → profile_cudagraph_memory() runs
 → worker dies during CUDA graph capture/warmup
 → EngineCore gets no response
 → worker proc died unexpectedly
determine_available_memory() is the step where vLLM calculates how much KV cache it can allocate. A crash here means the weights loaded successfully, but the memory estimation or capture for CUDA graph construction failed.
There are three likely causes.
1. CUDA graph capture is broken for this model/vLLM version/H200 combination
Add --enforce-eager to disable CUDA graph and check whether the process starts.
vllm serve deepseek-ai/DeepSeek-OCR-2 \
  --host 0.0.0.0 \
  --port 8000 \
  --logits_processors vllm.model_executor.models.deepseek_ocr:NGramPerReqLogitsProcessor \
  --no-enable-prefix-caching \
  --mm-processor-cache-gb 0 \
  --gpu-memory-utilization 0.1 \
  --max-model-len 8192 \
  --max-num-batched-tokens 8192 \
  --tensor-parallel-size 2 \
  --disable-custom-all-reduce \
  --enforce-eager
If this starts successfully, the problem is somewhere in the CUDA graph profiling/capture path.
2. Multiple vLLM instances are profiling memory on the same GPU simultaneously
vLLM's memory profiling calculates available memory based on free memory at startup. If another vLLM instance is starting up or already running, the free memory at the start of profiling and the free memory at CUDA graph capture time will differ. When multiple processes are simultaneously going through weight load → KV cache reserve → CUDA graph capture → NCCL init, memory and IPC contention can kill workers.
pkill -f "vllm serve"
nvidia-smi  # check for remaining python/vllm processes
Kill everything, then bring up just the problematic model on its own.
CUDA_VISIBLE_DEVICES=0 vllm serve deepseek-ai/DeepSeek-OCR-2 \
  --host 0.0.0.0 \
  --port 8000 \
  --logits_processors vllm.model_executor.models.deepseek_ocr:NGramPerReqLogitsProcessor \
  --no-enable-prefix-caching \
  --mm-processor-cache-gb 0 \
  --gpu-memory-utilization 0.3 \
  --max-model-len 8192 \
  --max-num-batched-tokens 8192 \
  --enforce-eager
If that works, remove --enforce-eager and re-enable CUDA graph to narrow down exactly where the issue reproduces.
3. --gpu-memory-utilization is too low to cover the CUDA graph budget
At H200 80 GB, --gpu-memory-utilization 0.1 is about 8 GB. That 8 GB has to cover model weights, activation peaks, CUDA graph memory estimates, KV cache, multimodal processor buffers, and communication buffers. If the budget is too tight, the worker will OOM during CUDA graph profiling. Start by disabling CUDA graph with --enforce-eager, then incrementally raise --gpu-memory-utilization to find the threshold.
Understanding CUDA Graph and --enforce-eager
Here we clarify some terms that are easy to confuse when --enforce-eager comes up.
Four Conceptual Layers
- CUDA: The base runtime/platform for running computations on NVIDIA GPUs. Both eager and graph modes ultimately run on CUDA.
- CUDA Graph: A performance optimization that records (captures) a sequence of CUDA kernel calls once and replays it on subsequent iterations. The actual computation doesn't change — only how the calls are dispatched.
- Eager mode (
--enforce-eager): Instead of using CUDA Graphs, PyTorch launches kernels one at a time on every step. - Eager attention: Computing the attention operation using standard PyTorch rather than a specialized backend like FlashAttention or FlashInfer. This is a different layer from
--enforce-eager.
The correct distinction is not "CUDA vs. eager mode" but "CUDA Graph mode vs. eager mode." Both use CUDA.
What CUDA Graph Does
LLM decode repeats small, identically shaped operations hundreds to thousands of times. Launching each kernel individually through Python/PyTorch/the CUDA runtime accumulates overhead fast. CUDA Graph captures that sequence of calls once and replays it, eliminating that overhead.
Plain eager:  every step → launch kernel A → launch kernel B → launch kernel C
CUDA Graph:   capture the A-B-C flow once → replay the graph on every subsequent step
The upside is lower decode latency and higher throughput. The downside is that capture requires additional memory upfront, and the operation shapes must be supported by the attention backend.
Piecewise vs. Full CUDA Graph
The log line profiling CUDA graph memory: piecewise=51 large=512 full=51 indicates the stage where vLLM prepares to decide how much of the model to capture.
- Piecewise: Operations incompatible with CUDA Graph (e.g., attention) run in eager mode while the rest (MLP, norm, etc.) are captured. Better compatibility across attention backends, but smaller performance gains than Full.
- Full: Captures a larger portion of the forward pass, including attention. Larger performance gains, but the attention backend must support it, and it is brittle with multimodal or dynamic-shape models.
When to Use --enforce-eager
| Situation | Decision |
|---|---|
Worker dies inside profile_cudagraph_memory() | Add --enforce-eager to isolate the cause |
| CUDA Graph instability with multimodal/OCR models | Keep --enforce-eager |
| Tight memory in a multi-model environment | Consider --enforce-eager |
| Confirmed stability, need to recover throughput | Remove --enforce-eager and retry |
If the worker still dies with --enforce-eager, the problem is no longer CUDA Graph — the search space shifts to the model implementation, attention backend, vLLM version, CUDA/NCCL, or the GPU worker itself.
Performance Trade-offs
| CUDA Graph | --enforce-eager | |
|---|---|---|
| Decode latency | Lower | Higher |
| Throughput | Higher | Lower |
| Initialization memory | More required | Less |
| Startup stability | Lower (capture can fail) | Higher |
| Dynamic shapes / multimodal | Fragile | Robust |
When first bringing up a multi-model stack, the standard approach is to establish stability with --enforce-eager first, then enable CUDA Graph afterward to recover performance.
Startup Order
When loading multiple models sequentially, start with the largest. The LLM needs to be settled before the others come up — this avoids OOM during initialization.
- Start the LLM and wait for
Application startup completein the logs. - Start the embedding model and confirm the same way.
- Start the OCR model.
After each model is up, send a quick request to verify it responds.
# LLM health check
curl http://localhost:10010/health

# Embedding smoke test
curl http://localhost:10020/v1/embeddings \
  -H "Content-Type: application/json" \
  -d '{"model": "Qwen3-Embedding-8B", "input": "test"}'
Summary: Practical Allocation Principles for H200 × 2
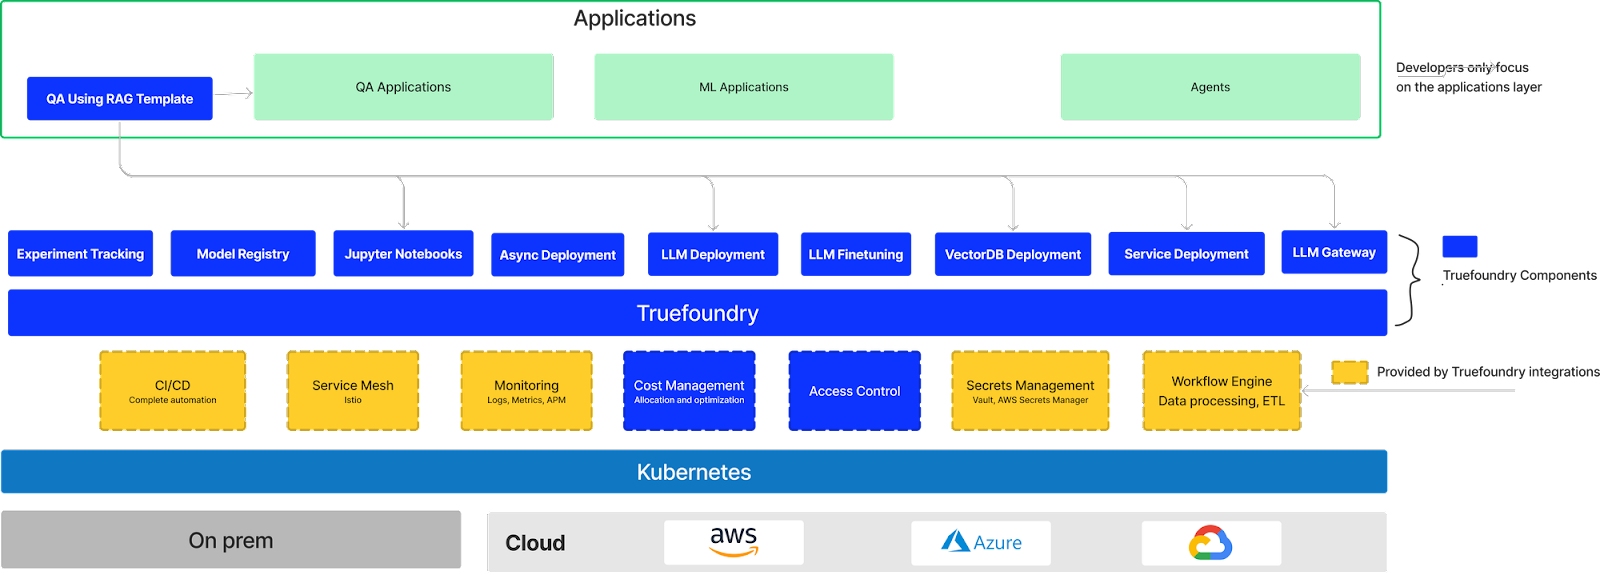
Multi-model deployment architecture overview (source: truefoundry.com)
- Keep the sum of
gpu-memory-utilizationacross all models at 0.85–0.90 or below per GPU. The remainder is reserved for CUDA context overhead. - Set
--max-model-lento match actual usage patterns. Qwen3.6-35B-A3B natively supports a context length of 262144, but 60–65536 is sufficient for most tasks. - For smaller models (8B and under), isolate them to specific GPUs with
CUDA_VISIBLE_DEVICESand serve withtp=1to reduce interference with the LLM. --enforce-eageris an emergency measure for tight memory situations. Skipping CUDA Graph saves roughly 1–2 GB but adds a small amount of latency on the first request.- For MoE models, calculate VRAM based on total parameter count, not active parameters.